 | | Short Term: |  |
|---|
| Medium Term: |  |
|---|
| Long Term: |  |
|---|
|
| R1 | 15.82 RL |
|---|
| R2 | 15.94 Feb 11 high |
|---|
| R3 | 16.145 March high |
|---|
| R4 | 16.36 October top |
|---|
| R5 | 16.87 UTL Jan/Feb lows |
|---|
| R6 | 17.75 20 DMA |
|---|
| R7 | 17.70 Apr high |
|---|
| R8 | 18.00 May high |
|---|
| R9 | 18.32 June 24 high |
|---|
| R10 | 21.60 July 2014 high |
|---|
|
| S1 | 17.33 UTL Jan/Jun low |
|---|
| S2 | 17.75 20 DMA |
|---|
| S3 | 17.15 40 DMA |
|---|
| S4 | 16.87 UTL Jan/Feb lows |
|---|
| S5 | 16.39 100 DMA |
|---|
| S6 | 15.15 Recent low |
|---|
| S7 | 15.06 38.2% Fibo (Dec-Feb rally) |
|---|
| S8 | 14.61 Recent dip low |
|---|
| S9 | 14.52 61.8% Fibo |
|---|
| S10 | 13.98 |
|---|
| S11 | 13.64 Dec low |
|---|
| Stochastics:Higher but looking overbought |
| Legend: DMA = Daily moving average RL = resistance line UTL = uptrend line H&S = head-and-shoulder pattern Fibo = Fibonacci replacement line |
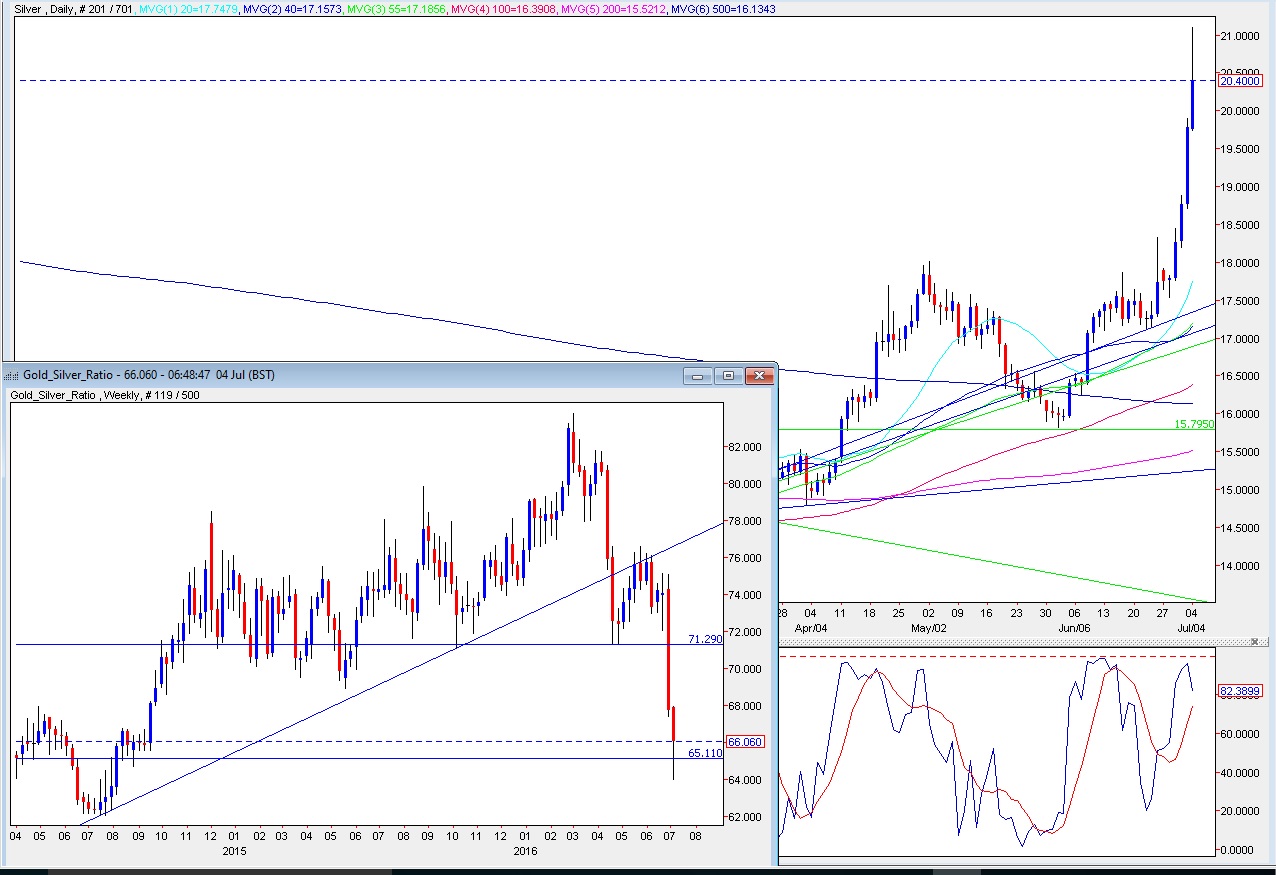
| Analysis- Silver has continued its sharp run higher, testing above $21 overnight amid strong demand from Chinese speculators.
- The long upper shadow so far today indicates overhead selling above $20.50.
- The stochastics are still bullish but the metal is clearly overbought – the RSI has risen to 86.7.
- Silver has cleared all of our near-term targets, with resistance above now seen at $21.60 – the July 2014 high.
- Support is seen at $20.32 after silver completed a long-term H&S.
- But there is the risk of a void below until the 20 DMA ($17.75) has a chance to catch up.
Other factors The AU/AG ratio has fallen to 64:1, its lowest since August 2014, which reflects greater strength relative to gold. But given its tendancy to overshoot at the bottom and tops of ranges, we wonder whether this is a warning that gold may be due to correct lower. Net length among Comex speculators increased for a third consecutive week, rising 3,418 contracts to 83,661 contracts in the week to June 28 – a record, based on FastMarkets’ historical data. Fund/CTAs added a small 613 contracts of new longs while covering a further 2,805 contracts of open shorts in the week after the UK EU referendum result. Over that period, silver climbed to a high of $18.32. Investment demand has proved more mixed recently: - ETF holdings are down 6 million ounces from their 2016 high.
- American Eagle coin sales slowed to a 2.8-million-ounce pace in June from 4.4 million ounces in May. Sales totalled 26.3 million ounces in the first half of the year, up 20 percent on the year-ago total.
- Silver coin/bar sales by the Perth Mint in the first five months of the year were up 166 percent on January-May 2015.
Silver supply is also likely to be tightening – the production cuts and closures at zinc and lead mines will also have hit by-product output of silver. The latest INEGI figures show mine production in Mexico contracted by 2.8 percent year-on-year in March, with output falling 5.2 percent in the first four months. ConclusionThere have been big gains for silver, with the metal surging above $21 at one point amid high turnover in China, as Shanghai Exchange Futures went limit-up. Further gains could target resistance at $21.60 but because of the elevated speculative length and with silver looking overbought on the charts there is the risk this could turn into another classic silver overshoot at the extremity of a peak/trough. | All trades or trading strategies mentioned in the report are hypothetical, for illustration only and do not constitute trading recommendations. |
|
The post SILVER TODAY – Another classic overshoot? appeared first on The Bullion Desk.
![]() Read More
Read More
Source: Bullion Desk News
Read More
Read More