 | | Short Term: |  |
|---|
| Medium Term: |  |
|---|
| Long Term: |  |
|---|
|
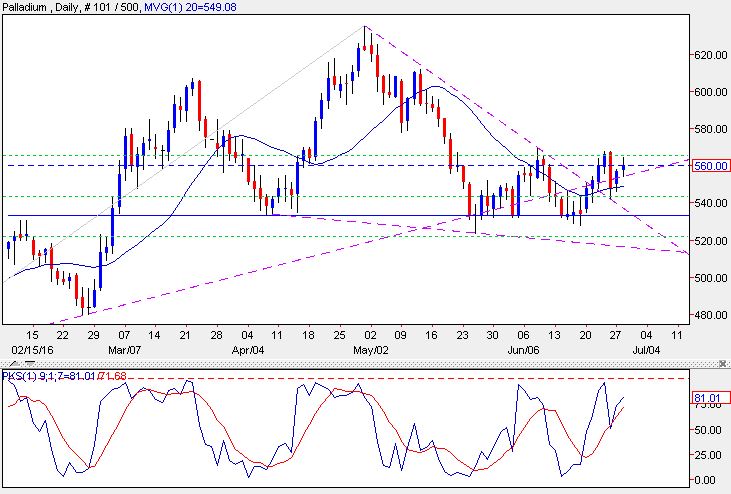
| R1 | 549 20 DMA |
|---|
| R2 | 570 Recent high |
|---|
| R3 | 612 Resistance |
|---|
| R4 | 620 61.8% Fibo |
|---|
| R5 | 635.50 High so far |
|---|
| R6 | 724 Oct high |
|---|
| R7 | 724-729 Former spike lows |
|---|
|
| S1 | 565 38.2% Fibo |
|---|
| S2 | 553 UTL |
|---|
| S3 | 549 20 DMA |
|---|
| S4 | 543 50% Fibo |
|---|
| S5 | 533 April dip low |
|---|
| S6 | 524 Dec low |
|---|
| S7 | 523.50 Recent low |
|---|
| S8 | 522 61.8% of Jan-Apr rally |
|---|
| S9 | 489 Early Feb low |
|---|
| S10 | 480 Feb low |
|---|
| S11 | 452 Low so far |
|---|
| S12 | 444 61.8% of 2008-2014 rally |
|---|
| Legend: MACD = Moving average convergence divergence
Fibo = Fibonacci retracement line
(H)SL = (Horizontal) support line
BB = Bollinger band
DMA = Daily moving average H&S = Head-and-shoulder formation |
| Analysis- Palladium prices are oscillating sideways between support around $528 and resistance at $570. This sideways trading could be forming the right-hand shoulder of a H&S pattern (although because this is being seen so close to the bottom of the long-term downward trend we are not convinced it is one).
- The recent pullback stopped short of breaking the 61.8% Fibo although it did breach the April low.
- Our overall longer-term view is that prices have turned the corner from a 2014-January 2016 bear market into the start of a bull market. So for now we will view this pullback as a test of support.
- The stochastics have turned higher, which suggests support is in place – it would take a move back above $570 to look bullish again.
Macro factors Last week fund shorts sold a further 1,052 contracts while longs bought 87 contracts. The net long fund position is 1,918 contracts, down from a recent high of 7,195 contracts and the lowest we have on record – dating back to 2007. The gross long position at 15,251 contracts is relatively low – it peaked at 33,865 contracts in September 2014 (see charts). ETF buying has picked up in recent days but it remains volatile and the funds do not look very engaged generally. Prices could also get lift if strikes are called in South Africa where wage negotiation are under way. The National Union of Mineworkers (NUM) last week demanded a 20-percent pay increase for its workers at Amplats as an opening gambit in the talks. Separately, the NUM is considering a strike against Eskom – the utility’s even-percent wage offer was well below the NUM’s demand or 18 percent. Electricity outages could hit mining. ConclusionPrices have been consolidating in recent weeks but have been trying higher in recent days. Still, they would need to overcome $570 to look bullish again. On balance, with a robust auto market and a supply deficit, we would expect prices to be well supported. It may take further evidence of a pick-up in China or industrial unrest before prices have the strength to rally. A rally could prompt fund short-covering and/or buying given how low the net long fund position has become. | All trades or trading strategies mentioned in the report are hypothetical, for illustration only and do not constitute trading recommendations. |
|
The post PALLADIUM TODAY – Funds’ net long position at multi-year low appeared first on The Bullion Desk.
![]() Read More
Read More
Source: Bullion Desk News
Read More
Read More