 | | Short Term: |  |
|---|
| Medium Term: |  |
|---|
| Long Term: |  |
|---|
|
| R1 | 1303.80 May high |
|---|
| R2 | 1333 20 DMA |
|---|
| R3 | 1359 Brexit-day peak |
|---|
| R4 | 1356 Top of triangle |
|---|
| R5 | 1375.25 High so far |
|---|
| R6 | 1388 HRL |
|---|
| R7 | 1434 Aug 2013 high |
|---|
|
| S1 | 1359 Previous peak |
|---|
| S2 | 1333 20 DMA |
|---|
| S3 | 1310.65 July low |
|---|
| S4 | 1303.80 May high |
|---|
| S5 | 1302.55 Recent support |
|---|
| S6 | 1293 UTL |
|---|
| S7 | 1199.85 May low |
|---|
| S8 | 1046.40 Dec low |
|---|
| Legend: R/SL= Resistance/support line HRL = horizontal resistance line UTL = Uptrend line BB = Bollinger band Fibo = Fibonacci retracement line H&S = Head-and-shouder pattern |
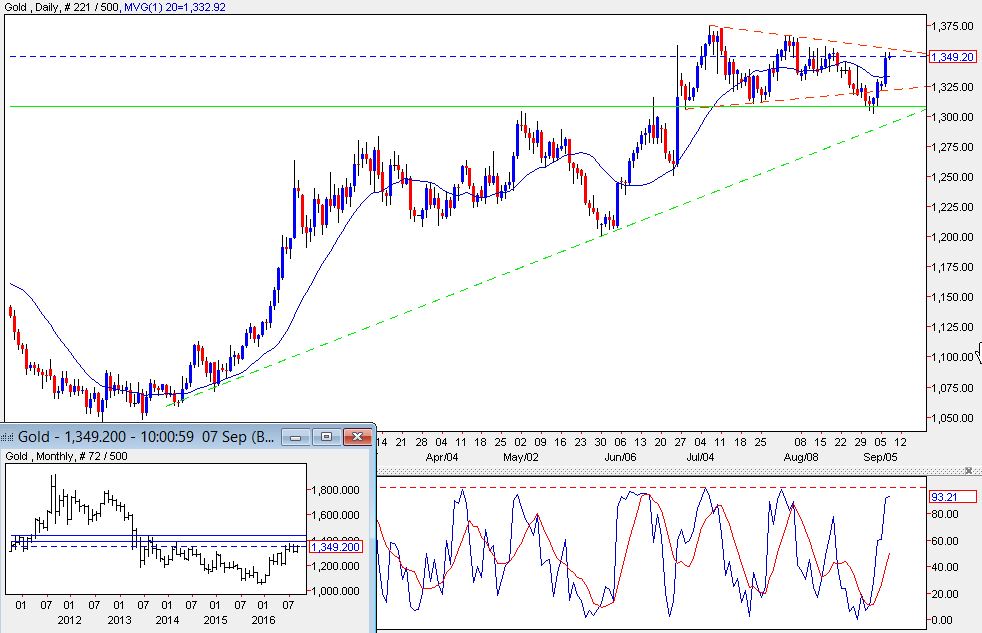
| Analysis- Gold prices are rebounding robustly despite having broken support (the bottom of the triangle) two weeks ago.
- The move lower now looks more like a false break.
- Prices have now risen to within striking distance of the top of the triangle at $1,356. There is also resistance at $1,358, $1,367.30 and the the July high at $1,375.25. Clearance of each of those levels will make the market look much stronger. Clearance of the July high would then target the two HRLs on the monthly chart (see inset chart) at $1,388 and $1,434.
- We have said of late that we remain bullish over the medium term but a profit-taking dip cannot be ruled out – we seem to have had the profit-taking dip and the rally is resuming.
Macro picture Profit-taking was not surprising but the fact it led to a false break lower shows underlying sentiment remains bullish. Gold prices had until yesterday been holding up well. The catalyst was more poor US data that prompted the market to reduce its expectations about a September rate rise to 15 percent from 21 percent. The dollar index has fallen to 94.92 from 96.25 a week ago. Physical demand for gold in Asia remains subdued but there are expectations that following a good monsoon this year the Indian harvest will be good, which in turn may well boost buying of gold in India. ETF buying continues – 13.8 tonnes were bought yesterday.
Friday’s CFTC report showed long liquidation continued up to August 30 but there was no fresh short selling by funds. This ties in with the view that the market was taking profits. The long position remains elevated so there could be more profit-taking if prices fail to push ahead but it looks as though prices are now rising again now. Needless to say, if prices fail on the upside, the gross short position is also low so short selling could pick up. We remain bullish overall, though, for the following reasons: - High global debt and how can that be dealt with
- US election – will there be another populist result there?
- The likelihood that the US interest rate will remain on hold
- Negative interest rates elsewhere
- Geopolitical unrest
- Potential for broad market corrections, especially in bonds and equities. The VIX at 13 is very low.
ConclusionGold prices rebounded strongly on Thursday and Friday and shot higher again yesterday. The profit-taking seems to have run its course and the lower prices have attracted follow-through buying. We feel prices will now have to push up into new high ground to avoid further stale long liquidation and possibly short-selling. Our big-picture outlook remains bullish but more profit-taking could easily be triggered if the price action disappoints. | All trades or trading strategies mentioned in the report are hypothetical, for illustration only and do not constitute trading recommendations. |
|
The post GOLD TODAY – Challenging resistance and looking bullish but… appeared first on The Bullion Desk.
![]() Read More
Read More
Source: Bullion Desk News
Read More
Read More