 | | Short Term: |  |
|---|
| Medium Term: |  |
|---|
| Long Term: |  |
|---|
|
| R1 | 1307.90 2015 high |
|---|
| R2 | 1375 High so far |
|---|
| R3 | 1388.70 March 2014 high |
|---|
|
| S1 | 1332 50 DMA |
|---|
| S2 | 1326 20 DMA |
|---|
| S3 | 1311 100 DMA |
|---|
| S4 | 1300 Psychological level |
|---|
| S5 | 1256 200 DMA |
|---|
| S6 | 1250 38.2% Fibo 2015 low to 2016 high |
|---|
| Legend: WMA = Weekly moving average DMA = Daily moving average UTL = Uptrend line RSI = Relative strength index H&S = Head and shoulder pattern |
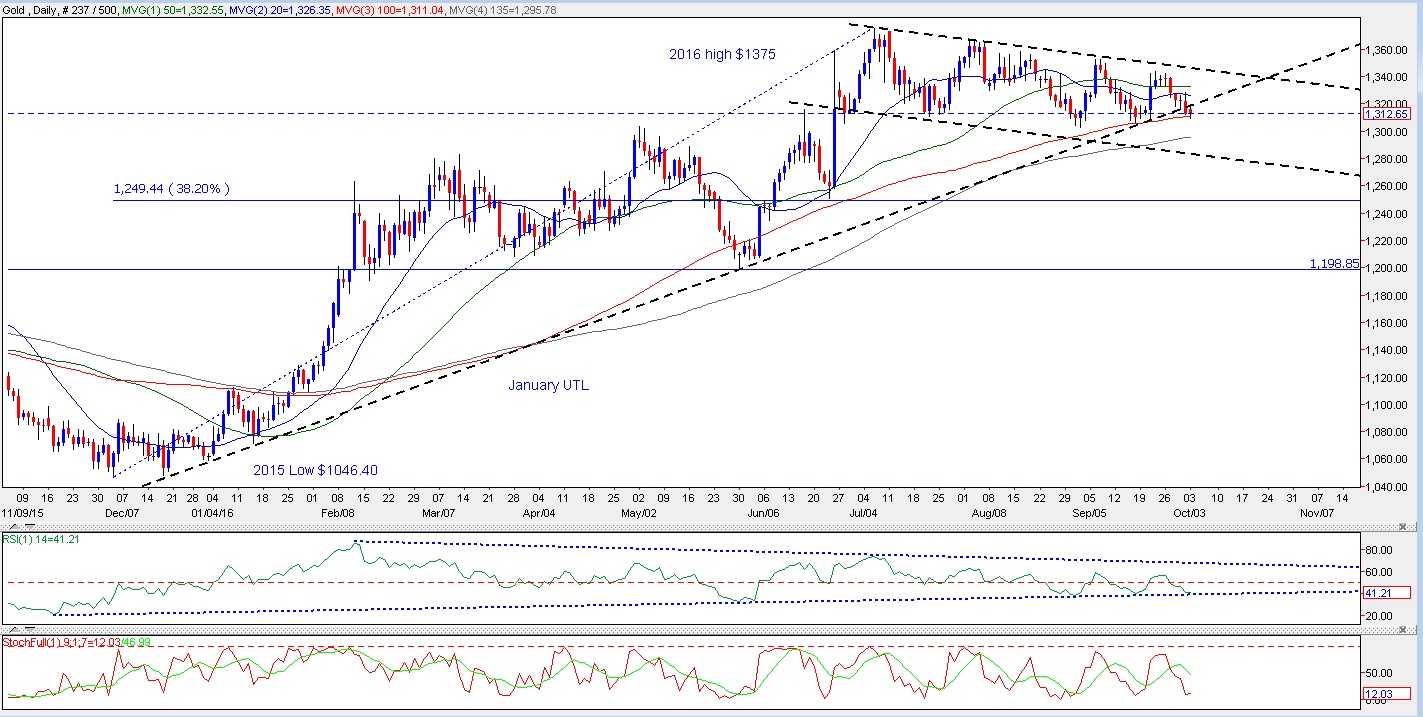
| Analysis- Gold has been trading in a declining flag formation in recent months and its price action has been disappointing. As well, it looks sluggish on the upside and its repeated failure to take out 2016 highs is an indication that the bulls are exhausted. There doesn’t seem to be much fuel left in the tank and its technical structure looks vulnerable to lower consolidation. Gold is threatening to break below this year’s UTL, which previously acted as technical support.
- If further selling materialises, nearby support is at the psychological level of $1,300. Failure to find support there might invite a retest of support of the 200 DMA. This is a strong demand zone that sits close to pre-Brexit lows at $1,249.50. Moreover, it coincides with 38.2% Fibo, making this particular price level potentially a pivotal support area.
- The daily RSI continue to head lower into oversold territory and the stochastic fast line has crossed bearishly, indicating that sellers are in contro. Further short-term price weakness cannot be ruled out.
Macro drivers Gold prices have rallied 31.4 percent since the December low at $1,046.40. Safe-haven demand increased due to the following factors: - The US Federal Reserve proposed in December four rate increases in 2016 but at best it might deliver just one rise before the end of the year
- Its inverse relationship with the dollar index has allowed gold to climb
- The growing number of negative-yielding sovereign bonds has made safe-haven assets that bear no yield much more appealing
- Pro-long utilisation of easy monetary policies by global central banks has eroded the value of paper money
- Speculative funds as well as ETF investors have flocked into gold in search of yield
Most of these boosted gold prices in 2016. While some may have a longer-term impact, others acted as short-term catalysts and now be been fully priced in. Some of the factors that could cause gold prices to trade sideways in an overall declining trend are: - Overstretched speculative longs show that this trade is very much overcrowded. With no fresh buyers, the path of least resistance is downward
- Speculators and ETF investors alike are sitting on large unrealised profits. Profit-taking could be a theme and, should panic ensue, panic selling could escalate
- The bulls’ resilience has not really been tested and a mild correction/pullback should do the overall bull structure a lot of benefit
- Physical demand has been stifled due to high future prices – the current rally has not had the backing of strong physical up-take
- The Fed has mobilised its policymakers to prepare the market with hawkish messages that the US economy is primed for a 25-basis-point-rate rise before the end of 2016
ConclusionIn the short term, we expect gold prices to remain under selling pressure. While the metal could consolidate lower and put the bulls to the test, it remains to be seen how long or deep the consolidation process will be. But we remain friendly towards gold – our medium-to-long-term view remains bullish and we could see the metal seeking a strong technical support to rebound into. | All trades or trading strategies mentioned in the report are hypothetical, for illustration only and do not constitute trading recommendations. |
|
The post GOLD TODAY – US Fed could raise rates as early as November appeared first on The Bullion Desk.
![]() Read More
Read More
Source: Bullion Desk News
Read More
Read More